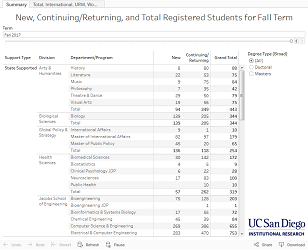
The final registration census report provides undergraduate, graduate, and professional student enrollment data for Fall, Winter and Spring terms starting from Fall 2004 through current term. Data can be filtered by school, college, department, major, types of degrees, student class level, status (new, continuing, and returning), and type of program support (state-supported or self-supporting). Undergraduate and graduate enrollment may be viewed by clicking on the corresponding dashboard tab. The report is updated after the 15th day of instruction each term.
This report shows trends in graduate student enrollment for the UC San Diego general campus by degree, type of support (tuition or self-supporting), gender, historically under-represented minority status (URM), and international student status. The report is updated every Fall term.
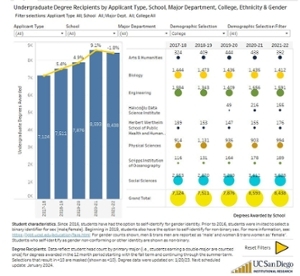
This dashboard provides data on of undergraduate degrees awarded to first-time first-year students and transfer students. The Degrees dashboard also provides 5-year trends, time-to-degree statistics, and GPA ranges at graduation. Data can be filtered by school, college, major department, gender, and race/ethnicity. The report is updated in January.
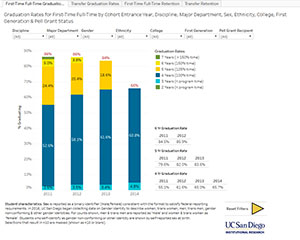
This dashboard provides 10-year trends in graduation and retention rates for first-time first-year students and transfer students by cohort entrance year. Data can be filtered by school, college, major department, gender, and race/ethnicity. The report is updated in January.
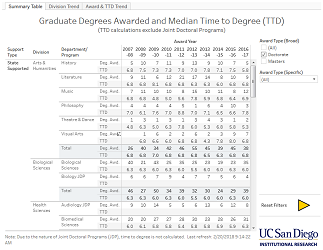
The dashboard presents degrees awarded and median time-to-degree for students in master’s, doctorate and professional doctorate programs starting from the 2012-13 academic year. The dashboard also displays trend graphs by school, gender, and URM status. Data can be filtered by school, degree, and award type. The report is updated in March.
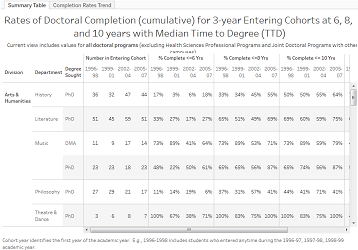
The tables and figures in this dashboard provide graduate student completion rates by major department and also 10-year completion rate trends by school, gender, and URM status. Data can be filtered by school and department. The report is updated in March.
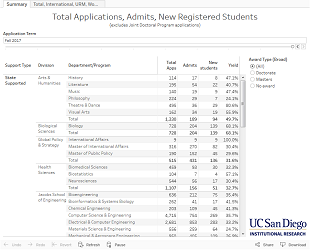
This dashboard includes the number of applications, admissions, and new graduate students by school, department, and type of academic program support. It also displays 10-year application and admission trends by gender, URM, and international student status. Data can be filtered by school, department, type of award, and program support. The report is updated in November.
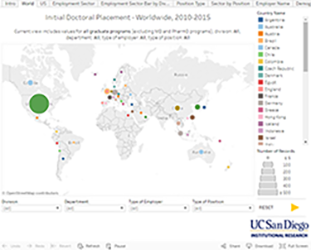
This dashboard reports data on the initial placement of doctoral recipients that received doctoral degrees. The report maps initial placement in the U.S. and abroad since the Summer, 2011 term. Graphs and tables present initial placement by employment sector, employer type, position type, employer name, and student demographics. Data can be filtered by school, gender, and race/ethnicity. The report is updated in March.
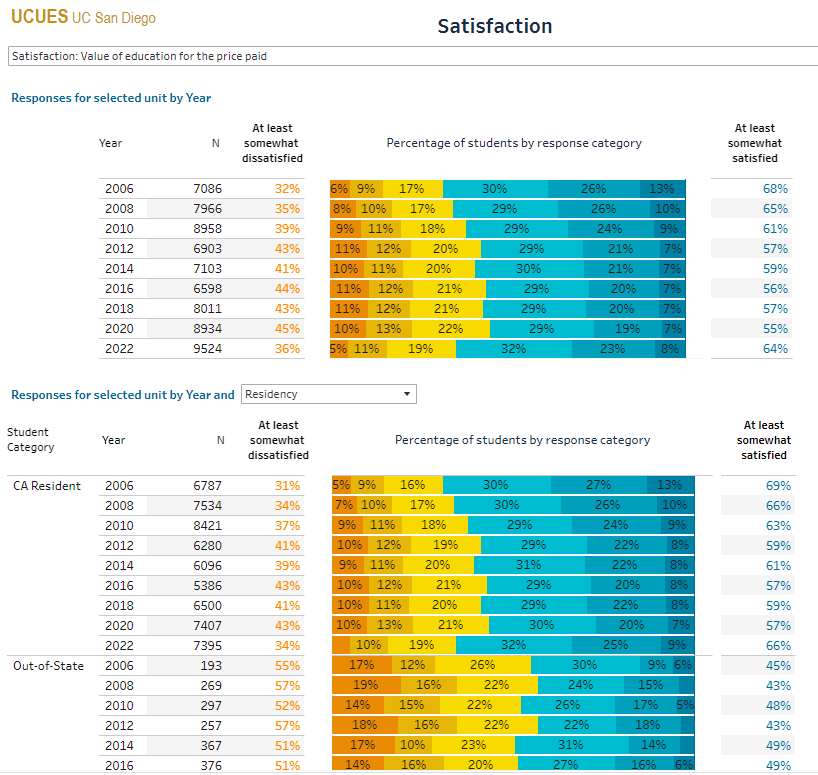
Beginning with the 2006 data, this longitudinal dashboard presents selected survey responses of participating undergraduate students with respect to their academic and research experiences, social and cultural experiences, satisfaction with majors, skills and activities, campus climate, and food and housing security. Answers to more than 250 questions are reported. Data are disaggregated by school, college, and department. This interactive tool allows for analysis of student responses by residency, gender, ethnicity, student level, and applicant type. The report is updated biennially in January. Dashboard access requires authorization via Active Directory (Single Sign-On).
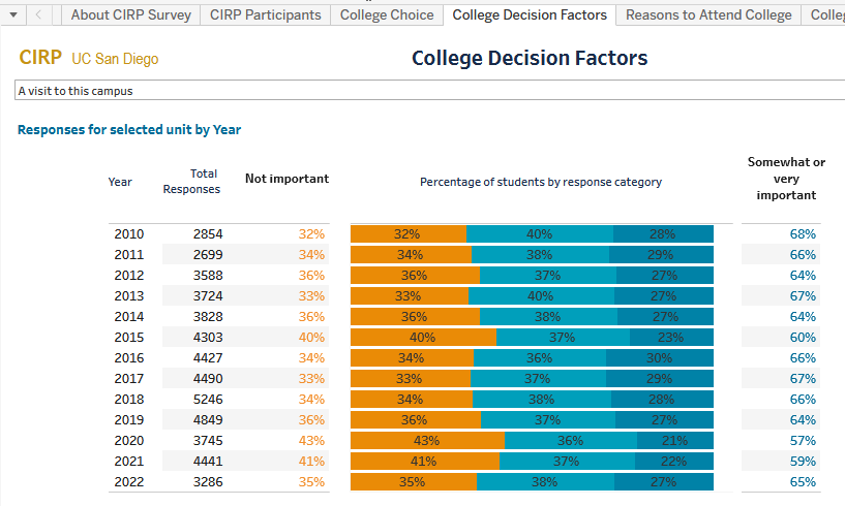
This longitudinal dashboard reports first year and transfer student responses to approximately 200 questions about their college selection and college preparation, college expectations, plans for the future, social agency, college involvement, civic participation, science orientations, and social and political views. Administered annually during undergraduate college orientations, this dashboard provides trend data from 2010 and are disaggregated by school, college, and major department. This interactive tool allows for analysis by residency, gender, ethnicity, student level, and applicant type. The report is updated annually in February. Dashboard access requires authorization via Active Directory (Single Sign-On).
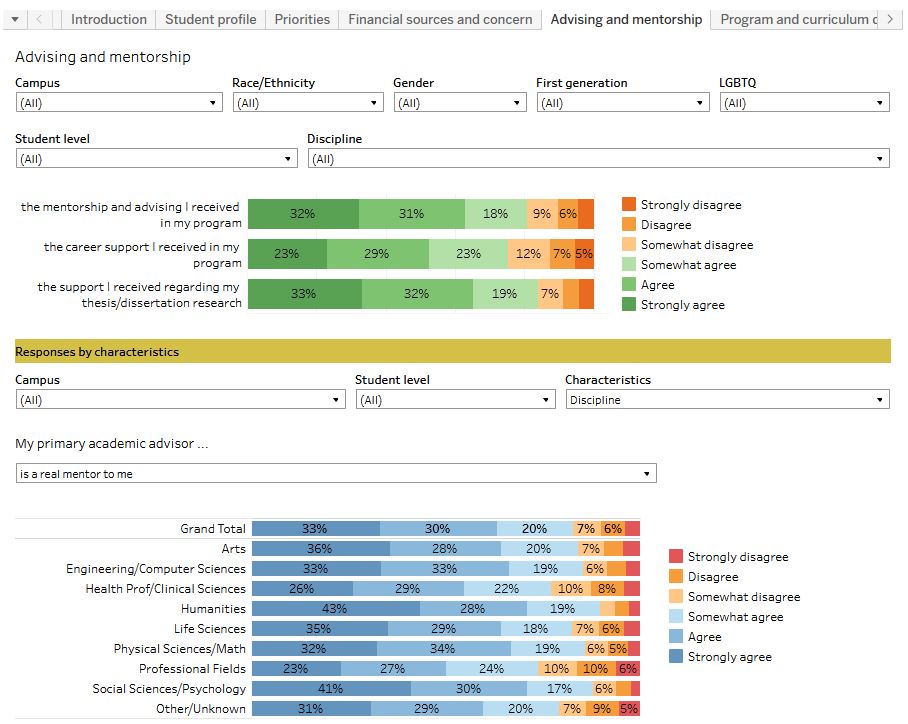
2021 University of California Graduate Student Experience Survey (UCGSES)
In this dashboard, the University of California Information Center presents 2021 graduate student survey results. Questions cover topics such as faculty advising and mentoring, program curriculum, program climate, mental health, academic progress, and career preparation. Graduate student responses can be filtered by race/ethnicity, gender, first generation status, LGBTQ status, studet level and discipline.
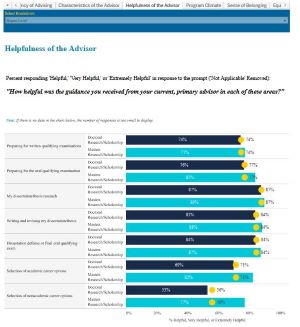
2021 Graduate Student Experience in the Research University (gradSERU)
This report examines the relationship between graduate education experiences, program characteristics, and development outcomes of master’s and doctoral students. Analysis provides comparison by gender, ethnicity, first generation status, and student level.
This report examines the relationship between graduate education experiences, program characteristics, and development outcomes of master’s and doctoral students. Analysis provides comparison by gender, ethnicity, first generation status, and student level.
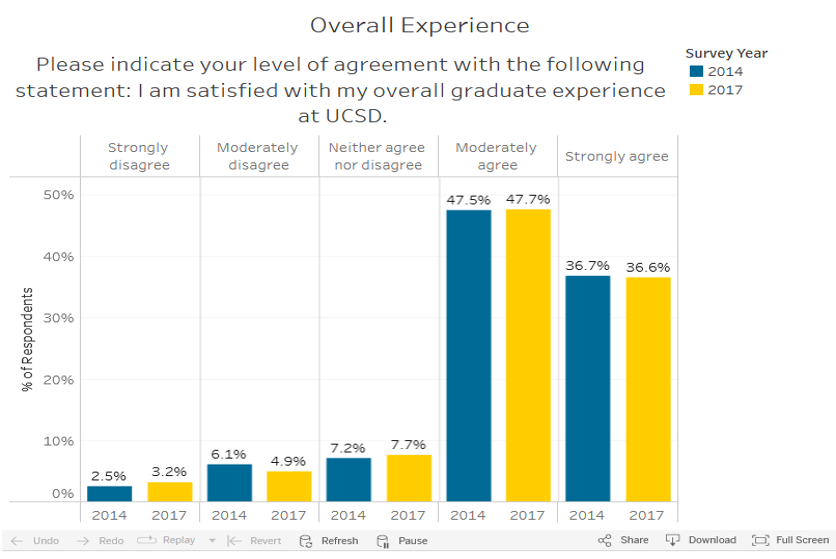
This 2017 report presents results of the graduate student survey which covers responses to a number of questions on topics related to academic and research experiences, satisfaction with academic program and advising, campus climate, challenges and stressors. Some tables and graphs provide analysis by department, gender, ethnicity, residency, and primary language.
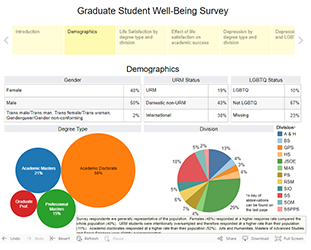
This 2016 report provides analysis of the effects graduate students’ life satisfaction, mentorship and advising , depression, financial confidence, and food insecurity bare on academic success and career prospects. Tables and graphs in the report provide data comparison by school, degree type, ethnicity, and sexual orientation.