Graduate Student Statistics

Enrollment

Graduate Enrollment

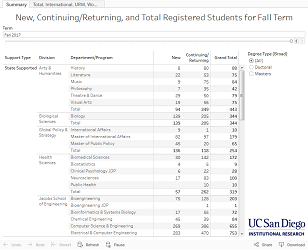
The final registration census report provides graduate and professional student enrollment data for Fall, Winter and Spring terms starting from Fall 2004 through current term. Data can be filtered by school, department, major, degrees, status (new, continuing/returning), and type of program support (state-supported or self-supporting). Graduate enrollment may be viewed by clicking on the corresponding dashboard tab. The report is updated after the 15th day of instruction each term.

Graduate Enrollment Trends

This report shows trends in graduate student enrollment for the UC San Diego general campus by degree, type of support (tuition or self-supporting), gender, historically under-represented minority status (URM), and international student status. The report is updated every Fall term.

Graduate Enrollment Trends

Degrees, Time to degree, and Completion Rates

Graduate Degrees Awarded and Time to Degree

The dashboard presents degrees awarded and median time-to-degree for students in master’s, doctorate and professional doctorate programs starting from the 2012-13 academic year. The dashboard also displays trend graphs by school, gender, and URM status. Data can be filtered by school, degree, and award type. The report is updated in March.

Graduate Student Completion Rates

The tables and figures in this dashboard provide graduate student completion rates by major department  and also 10-year completion rate trends by school, gender, and URM status. Data can be filtered by school and department. The report is updated in March.

Admissions

Graduate Admissions

This dashboard includes the number of applications, admissions, and new graduate students by school, department, and type of academic program support. It also displays 10-year application and admission trends by gender, URM, and international student status. Data can be filtered by school, department, type of award, and program support. The report is updated in November.
Post Graduation Experiences

Initial Placement of Doctoral Recipients

This dashboard reports data on the initial placement of doctoral recipients that received doctoral degrees. The report maps initial placement in the U.S. and abroad since the Summer, 2011 term. Graphs and tables present initial placement by employment sector, employer type, position type, employer name, and student demographics. Data can be filtered by school, gender, and race/ethnicity. The report is updated in March.

Student Diversity

Graduate Students

The UC Information Center provides historical graduate and professional programs enrollment data starting in Fall 1999. Graduate data are disaggregated by residency, gender, ethnicity, sexual orientation, country of origin, and program support. Data can be filtered by program type, student enrollment status, and field of study.